Welcome to our first team-specific projection of 2024. Every offseason, I undertake the process of creating projections for every team. In previous years, this involved developing a projection that I believed would represent the average performance of all relevant players if a given season were played out thousands of times. This year, I have added steps to better understand how a player’s fantasy scoring could increase or decrease if changes in his market shares or his team’s play volumes were considered. Although my projections will inevitably have some large variances from actuals, this process will allow us to better understand a player’s potential upside and downside. (Quarterbacks were not included in this process as more nuance would be required and this exercise felt like one more suitable for the other positions. If time allows, I will hone in on something similar for passers.)
Team Level Considerations
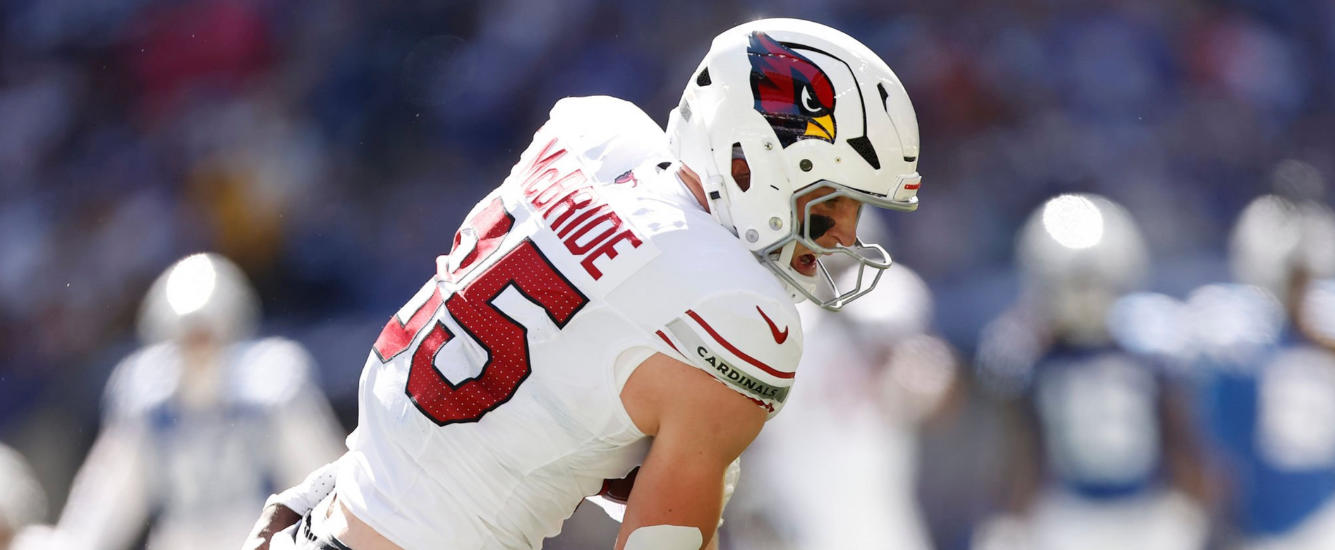
My baseline projection positions the Cardinals as a middle-of-the-road team in terms of overall play volume. Specifically, it places the team in the 51st percentile for passing attempts and the 35th percentile for rushing attempts based on my 2024 projections set at the time this article was published.
Baseline Projections Player-Level Summary
The visual below highlights the key drivers of fantasy scoring based on my initial 2024 projections. For each player, I have included their percentile ranking for each stat, comparing them to other fantasy-relevant players at the same position. In this exercise, fantasy-relevant players are identified based on their team’s projected depth chart. For example, the stats of any WR listed as the WR1, WR2, or WR3 on his team will contribute to the percentile calculations for WRs.

- Kyler Murray is able to offset moderate passing numbers with a strong performance as a rusher.
- Trey Benson’s eight overall touchdowns might be high, but it’s easy to picture him picking up a portion of any lost points through receptions.
- Some of the upside that Marvin Harrison Jr. could realize would likely come through increased touchdown production alongside a notable increase in receptions.
Market Share Changes
The table below provides an overview of what I expect each player’s lowest and highest market shares would be in “reasonable edge cases,” assuming no major injuries to the player or other players on the team, and no significant trades. The “Downside” column highlights the player’s lowest scoring outcome from these scenarios, while the ‘Upside’ column shows his highest scoring outcome. The “Spread” column simply subtracts the downside from the upside to give us a general sense of the range of outcomes a player might possess.
In reality, a player could see both his rushing and target share hit low values or the opposite. I chose not to factor that into the analysis, as those instances are likely outliers and would distract from the overall goal of the exercise. Most players will have fluctuations in their shares or overall opportunity as a result of variances between projected and actual team-level volume and will land somewhere between the extremes.


