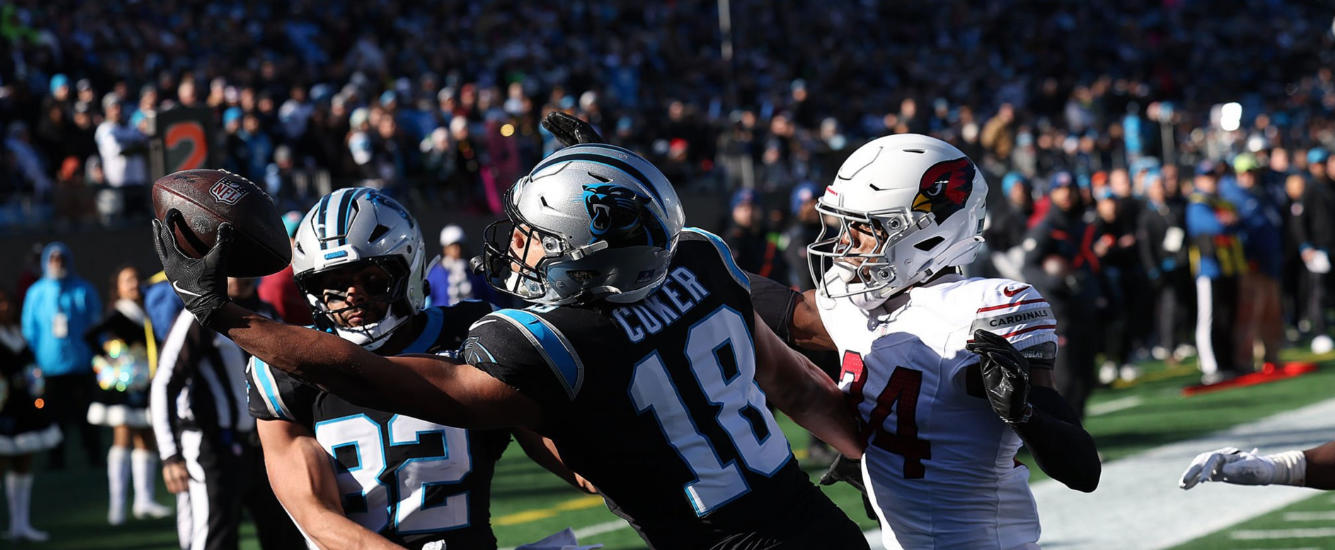
In this article we’ll explore the power of k-means clustering analysis to figure out how we could have taken down the slate the most effectively. By isolating the projected Vegas spread, game total, matchup, projected points, salary, risk, and reward, we should be able to uncover some insights to help us in the coming weeks. Week 2 of the NFL season brought us a plethora...
- 2025 Rookie Guide
- Monday Review
- Tools
FANTASY FOOTBALL Tools
In-Season
NOTE: Our tools will be updated each week as soon as data from our stats provider is available. Generally, data from Sunday’s games will be available early Tuesday afternoon. For an immediate look at the games from the previous weekend, please check out our Monday Review tool which includes a collection of preliminary stats.
- All NFL
- Best Ball
- Dynasty
Dynasty
- Weekly GLSP
- Rankings
Unpacking Week 2: K-Means Clustering for DFS Insights

Please subscribe For Full Access to all RotoViz content and tools!
What’s included in your subscription??
- Exclusive Access to RotoViz Study Hall
- A treasure trove of our most insightful articles that will teach you the metrics that matter, time-tested winning strategies, the approaches that will give you an edge, and teach you how to be an effective fantasy manager.
- Revolutionary Tools
- Including the NFL Stat Explorer, Weekly GLSP Projections, NCAA Prospect Box Score Scout, Combine Explorer, Range of Outcomes App, DFS Lineup Optimizer, Best Ball Suite,and many, many, more.
- Groundbreaking Articles
- RotoViz is home of the original Zero-RB article and continues to push fantasy gamers forward as the go-to destination for evidence-based analysis and strategic advantages.
- Weekly Projections
- Built using RotoViz’s unique GLSP approach.
- Expert Rankings
- And a whole lot more…
Matt Spencer
Machine Learning Approach to Football Analytics with JavaScript

DFS Insights for the Week 5 Slate with K-Means Cluster Analysis
Matt Spencer
October 7, 2023
Welcome back to the series! In the previous installment, we dissected the strategies for Week 4 of the 2023 NFL season using k-means clustering. If you missed it, you could catch up here. This week we made major upgrades to the analysis. Methodology (In-Brief) Aggregated projections from six sources for the first five weeks Collected the actual results of the first four weeks. Collected information…...

DFS Insights for the Week 4 Slate with K-Means Cluster Analysis
Matt Spencer
September 28, 2023
Welcome back to the series! In the previous installment, we dissected the strategies that worked for Week 2 of the 2023 NFL season retroactively using k-means clustering. If you missed it, you can catch up on our initial entry here. Now, armed with insights from the first three weeks, we’re ready to tackle Week 4 and recommend a robust player pool for DFS success. Methodology…...

Are NFL Running Backs Underpaid? Unraveling True Value at a Controversial Position
Matt Spencer
July 20, 2023
Fantasy football discussions are often marred by misinformation and skewed comparisons. A recent viral tweet comparing the average salaries of NFL kickers to those of running backs is a prime example. Can someone please explain this? pic.twitter.com/e9XgywpOF9 — Dez Bryant (@DezBryant) July 18, 2023 This tweet exploded as part of the current discourse over a potential NFL running back holdout. It was shared by seemingly…...
DFS Insights for the Week 5 Slate with K-Means Cluster Analysis
Matt Spencer
October 7, 2023
Welcome back to the series! In the previous installment, we dissected the strategies for Week 4 of the 2023 NFL season using k-means clustering. If you missed it, you could catch up here. This week we made major upgrades to the analysis. Methodology (In-Brief) Aggregated projections from six sources for the first five weeks Collected the actual results of the first four weeks. Collected information…...
DFS Insights for the Week 4 Slate with K-Means Cluster Analysis
Matt Spencer
September 28, 2023
Welcome back to the series! In the previous installment, we dissected the strategies that worked for Week 2 of the 2023 NFL season retroactively using k-means clustering. If you missed it, you can catch up on our initial entry here. Now, armed with insights from the first three weeks, we’re ready to tackle Week 4 and recommend a robust player pool for DFS success. Methodology…...
Are NFL Running Backs Underpaid? Unraveling True Value at a Controversial Position
Matt Spencer
July 20, 2023
Fantasy football discussions are often marred by misinformation and skewed comparisons. A recent viral tweet comparing the average salaries of NFL kickers to those of running backs is a prime example. Can someone please explain this? pic.twitter.com/e9XgywpOF9 — Dez Bryant (@DezBryant) July 18, 2023 This tweet exploded as part of the current discourse over a potential NFL running back holdout. It was shared by seemingly…...
Analysis

Week 18 Monday Review: 16 Actionable Insights From Fantasy’s Forgotten Week
Kevin Szafraniec
January 5, 2026

The RotoViz Week in Review: Keep an Eye On This First-Year RotoViz Riser
Kevin Szafraniec
January 4, 2026

Week 17 WR Advanced Stats: Has Christian Watson Established Himself as Green Bay’s Alpha WR?
Kevin Szafraniec
January 3, 2026
Rookie Season Recap and Thoughts on the Near Future
Jesse Cohen
January 2, 2026

Week 17 Running Back Advanced Stats: Breece Hall, Zach Charbonnet, and Audric Estime
Corbin Young
January 2, 2026

Week 17 Monday Review: These 3 Games Provided a High Concentration of 2025 League Winners
Kevin Szafraniec
December 29, 2025
The RotoViz Week in Review: The Rookies Poised to Shape Week 17
Kevin Szafraniec
December 28, 2025
Week 16 Running Back Advanced Stats: Ashton Jeanty and Tony Pollard Could Win Leagues
Corbin Young
December 27, 2025
Related Articles
In-Season Articles
In-Season Articles

Week 18 Monday Review: 16 Actionable Insights From Fantasy’s Forgotten Week
Kevin Szafraniec
January 5, 2026

The RotoViz Week in Review: Keep an Eye On This First-Year RotoViz Riser
Kevin Szafraniec
January 4, 2026

Week 17 WR Advanced Stats: Has Christian Watson Established Himself as Green Bay’s Alpha WR?
Kevin Szafraniec
January 3, 2026

Rookie Season Recap and Thoughts on the Near Future
Jesse Cohen
January 2, 2026

Week 17 Running Back Advanced Stats: Breece Hall, Zach Charbonnet, and Audric Estime
Corbin Young
January 2, 2026

Week 17 Monday Review: These 3 Games Provided a High Concentration of 2025 League Winners
Kevin Szafraniec
December 29, 2025

The RotoViz Week in Review: The Rookies Poised to Shape Week 17
Kevin Szafraniec
December 28, 2025

Week 16 Running Back Advanced Stats: Ashton Jeanty and Tony Pollard Could Win Leagues
Corbin Young
December 27, 2025
Related Articles

Week 18 Monday Review: 16 Actionable Insights From Fantasy’s Forgotten Week
Kevin Szafraniec
January 5, 2026

The RotoViz Week in Review: Keep an Eye On This First-Year RotoViz Riser
Kevin Szafraniec
January 4, 2026

Week 17 WR Advanced Stats: Has Christian Watson Established Himself as Green Bay’s Alpha WR?
Kevin Szafraniec
January 3, 2026

Rookie Season Recap and Thoughts on the Near Future
Jesse Cohen
January 2, 2026

Week 17 Running Back Advanced Stats: Breece Hall, Zach Charbonnet, and Audric Estime
Corbin Young
January 2, 2026

Week 17 Monday Review: These 3 Games Provided a High Concentration of 2025 League Winners
Kevin Szafraniec
December 29, 2025

The RotoViz Week in Review: The Rookies Poised to Shape Week 17
Kevin Szafraniec
December 28, 2025

Week 16 Running Back Advanced Stats: Ashton Jeanty and Tony Pollard Could Win Leagues
Corbin Young
December 27, 2025
The Blitz

About

Sign-up today for our free Premium Email subscription!
Data provided by
© 2021 RotoViz. All rights Reserved.

