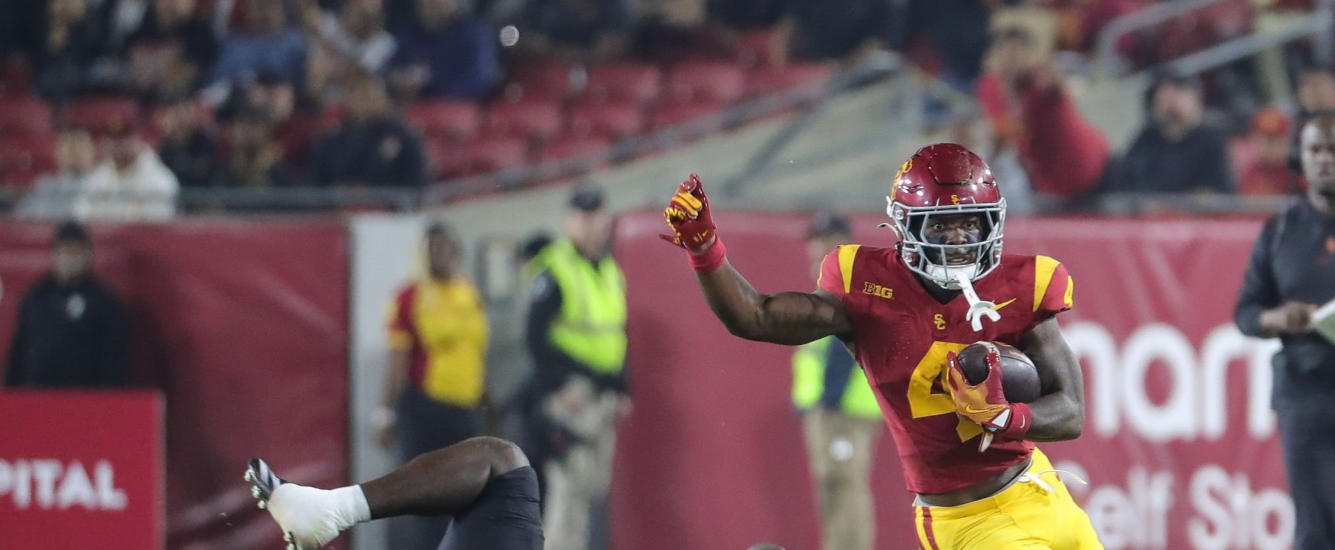
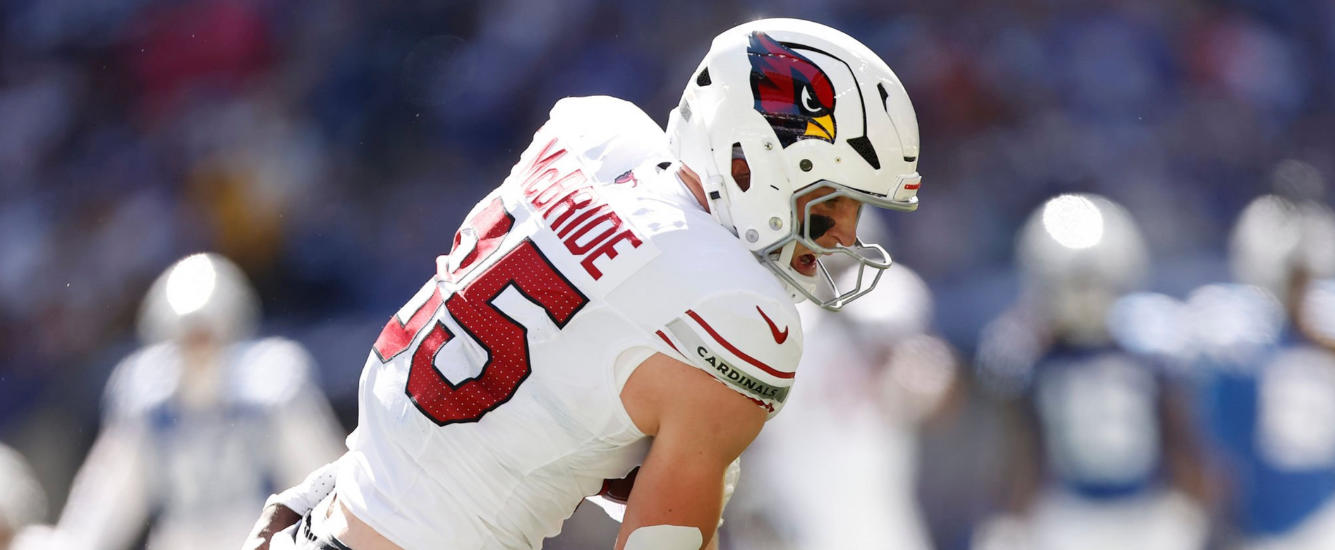
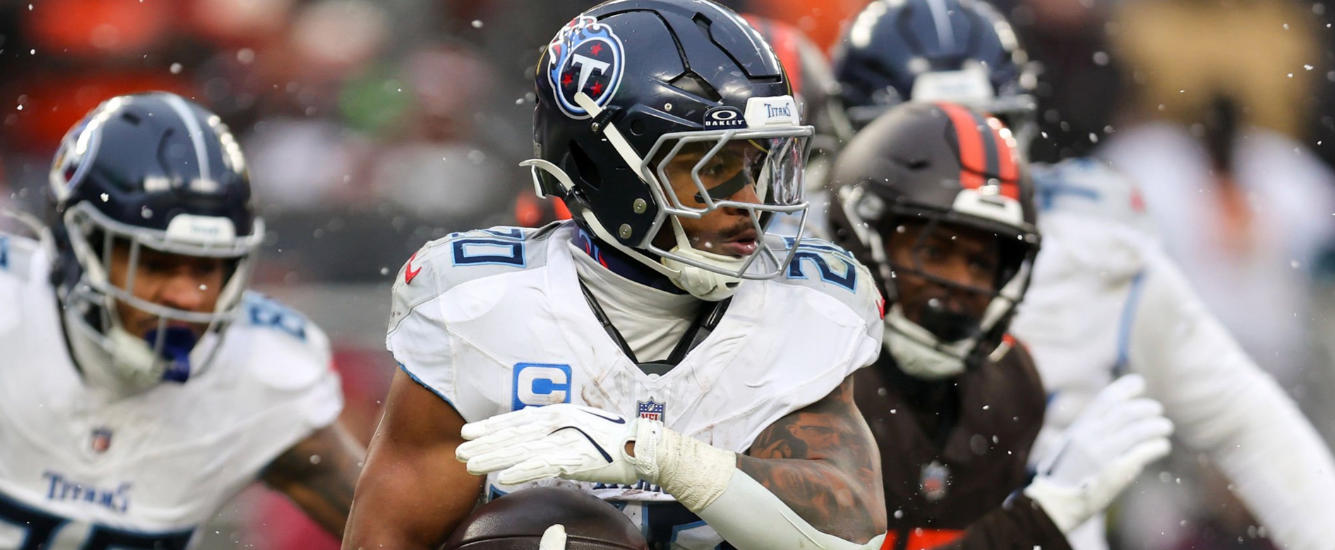
Earlier this week I published the backfield dominator ratings (BDR) for the 2023 running back class. Chase Brown ranked No. 4 in BDR, thanks in large part to the number of opportunities he saw in Illinois’ offense. He had at least 20 touches and surpassed 100 total yards in every single game.
| Opponent | RuAtts | RuYds | RuTDs | RuAttMS | RuYdMS | Recs | ReYds | ReTDs | Touches | TotalYds |
|---|---|---|---|---|---|---|---|---|---|---|
| Wyoming | 19 | 151 | 2 | 0.49 | 0.59 | 3 | 16 | 1 | 22 | 167 |
| Indiana | 36 | 199 | 0 | 0.84 | 0.98 | 1 | 6 | 0 | 37 | 205 |
| Virginia | 20 | 146 | 0 | 0.56 | 0.78 | 1 | 3 | 0 | 21 | 149 |
| Chattanooga | 20 | 108 | 1 | 0.63 | 0.61 | 2 | 6 | 0 | 22 | 114 |
| Wisconsin | 25 | 129 | 1 | 0.81 | 0.89 | 1 | 6 | 0 | 26 | 135 |
| Iowa | 31 | 146 | 0 | 0.84 | 0.89 | 4 | 17 | 0 | 35 | 163 |
| Minnesota | 41 | 180 | 0 | 0.8 | 0.89 | 3 | 53 | 1 | 44 | 233 |
| Nebraska | 32 | 149 | 1 | 0.76 | 0.99 | 3 | 13 | 1 | 35 | 162 |
| Michigan State | 33 | 136 | 0 | 0.8 | 0.83 | 2 | 21 | 0 | 35 | 157 |
| Purdue | 23 | 98 | 2 | 0.85 | 0.97 | 3 | 32 | 0 | 26 | 130 |
| Michigan | 29 | 140 | 2 | 0.88 | 0.96 | 3 | 24 | 0 | 32 | 164 |
| Northwestern | 19 | 61 | 1 | 0.59 | 0.37 | 1 | 43 | 0 | 20 | 104 |
From Week 5 to Week 12 his rushing yardage share never dropped below 83%. In four consecutive games during that stretch (Weeks 6-10) he had at least 30 carries and two receptions. Only two RBs (DeWayne McBride and Mohamed Ibrahim) averaged more rushing yards per game in 2022. As a result of this crazy production, Brown’s draft-agnostic Box Score Scout comps are an impressive mix of first- and second-round RBs.

Yet most recent mock drafts have Brown going off the board in the fourth or fifth round. Is this another case where the NFL is undervaluing RB production, or is the Box Score Scout missing some important context? It’s worth taking a closer look at some of the possible reasons NFL scouts might not be so enamored of Brown, despite his crazy production numbers.
Opportunity, Efficiency, and Expected Points Added
One clue to understanding why NFL teams might not be as enthusiastic about Brown as the Box Score Scout reveals itself when we look closer at some of the past BDR leaders. A number of the top names in recent seasons have also been among the leaders in total touches. Many of them have not, however, produced the number of yards we would expect based on their touches. The graph below includes every draftable RB in the previous five seasons with a BDR of at least 0.7.

This is a simplistic way to measure efficiency, but shows clearly which players are producing yards in excess of what we would expect given their touches, and which are falling below their touch-based expectations. Now, since receiving touches are (generally) more efficient than rushing touches, players with a larger share of receiving touches will naturally look more efficient. But the effect is smaller in college than in the NFL, and we want to chase players with receiving talent anyway. In other words, we could look at this as a feature, rather than a bug.
I’ve used blue and red boxes in an attempt to distinguish high-touch backfield dominators who have gone on to NFL success from those who have not. Note how the previous BDR leaders in the red box (Eno Benjamin, Tyler Goodson, and Patrick Laird) all fell short of meeting touch-based expectations in their final college seasons. On the other hand, previous BDR leaders who were hits (Saquon Barkley, Breece Hall, Jonathan Taylor, and Phillip Lindsay) either surpassed their opportunity-based expected yardage totals, or at least (in Lindsay’s case) came much closer.
Of course, numerous of the players in the “winners” box have not had productive NFL careers. They certainly haven’t been as productive as David Montgomery.[1]RotoViz warned drafters that Montgomery’s lack of athleticism was showing up in a lack of efficiency that couldn’t be ignored just because of a strong broken tackle rate. Subscribers avoided overpaying in rookie drafts. Now public opinion has arguably swung too far the other direction, with Montgomery not getting full credit for his flexibility and production with the Bears. The thing that most clearly distinguishes the winners from the losers in this chart is something else: draft capital (Lindsay is the notable exception here — even draft capital isn’t a perfect predictor). That is to say, while the NFL does seem to undervalue production as a whole, efficiency (particularly on the rushing side) may be something NFL decision makers pay (too much) attention to. The question is, how much does this sort of efficiency actually matter? And specifically how much does it matter in Brown’s case?
Chase Brown’s Efficiency
Brown averaged just over 5.0 yards per carry in his final season, but in general did not gain as many total yards as we might expect given his total touches. If we add 2023 players to the chart above, we can see where Brown slots in compared to previous BDR leaders.

Off the bat we notice that Brown has handled more touches than any other backfield dominator over the last six years. He’s also come much closer to meeting touch-based expectations than any of Benjamin, Goodson, or Laird. But he still falls on the wrong side of the trend line, along with many other players the NFL arguably overlooked due to poor efficiency (including Lindsay). However, there’s more to the story of Brown’s efficiency.
Illinois’ Offense
Footnotes[+]Footnotes[−]
| ↑1 | RotoViz warned drafters that Montgomery’s lack of athleticism was showing up in a lack of efficiency that couldn’t be ignored just because of a strong broken tackle rate. Subscribers avoided overpaying in rookie drafts. Now public opinion has arguably swung too far the other direction, with Montgomery not getting full credit for his flexibility and production with the Bears. |
|---|

