Last week I went through the process of transforming your projections to include expected first downs. Now that Dave Caban dropped the official RotoViz projections, we can explore the snake draft simulation tool I created.
I was lucky enough to be invited to participate in the Scott Fish Bowl Tournament again this year. One of Scott’s goals with this format is to create a really balanced and nuanced alternative to PPR as Hasan Rahim breaks down in his 2017 article. After exploring my new optimization tool, I can conclusively say that he managed to create the most balanced format across different positions I have ever analyzed. You will see what I mean when we get to the simulations.
Scoring
You can find all of the rules for the tournament on the official website, but I will break down all of the non-standard scoring options and how they impact your rankings.
Passing
- 6 point passing TD
- -4 point interception
- -2 point interception for TD
- Approximately 7.85% of interceptions resulting in opposing touchdowns. You can account for this by adjusting your scoring to -4.17 per interception.
- 1 point for 25 yards passing (0.04/yard),
- 2 point per 2 point conversions
- -1 point per sack [1]It’s been theorized that QBs own their sacks, so this addition is in line with Scott’s goal of punishing poor play.
- Using a similar approach to my previous article we can approximate sacks with:

- Using a similar approach to my previous article we can approximate sacks with:
- -1 point per incompletion
- 0.5 points per completion
Most of these will look familiar to you, but they have all been slightly tweaked to specifically throttle players like Blake Bortles from being fantasy relevant. In this format it is very possible for your QB to post a negative score. Just ask Drew Lock owners from last year.
Rushing and Receiving
- 6 point rushing TD
- 1 point for 10 yards rushing (0.1/yard),
- 2 points for 2 point conversions
- .5 point per 1st down
- 6 point receiving TD
- 1 point for 10 yards receiving (0.1/ yard)
- 0.5 points per reception
TE:
- Extra 0.5 points per first down
- Extra 0.5 points per reception
The rules for rushing and receiving are nearly standard for a 0.5 PPR format, but you will find the addition of 1st downs. As I broke down in my previous article the idea here is that catching passes at the line of scrimmage and then falling down should not count the same as a critical drive extending reception for a 1st down.
Additionally, you will notice that Scott has included a premium for TEs. He wants you to care about TEs. As a voracious RotoViz subscriber, you should already prioritize TEs in all formats, but in the SFB11 tournament, I have three TEs projected to outscore the QB14, forcing your hand.
Kickers
- Decimal Scoring for FG (37 yarder = 3.7 points, 24 yarder = 2.4 points)
- The average field goal is kicked at a distance of 32 yards. Assigning 3.2 points per field goal made will simplify your projections.
- 1 point for an extra point
- -3 for a missed FG
- -1 for a missed XP
- Historically 92.97% of extra points are made. If you assume all players are equal,[2]They aren’t, but I will get into why we don’t care later. you can just assign +0.86 points per projected extra point made.
Rather than going through the effort of projecting out each individual kicker, I relied on historical norms to place them in the draft based on positional value. In 2020 just three kickers scored enough points to justify being weekly starters. Now guess if its the three kickers we thought it would be?[3]Spoiler: it wasn’t With kickers being notoriously difficult to project prior to the season they still just aren’t worth drafting. However, if you look at weekly scoring the position is extremely volatile. I will be streaming kickers in my last flex spot, particularly when I am projected to lose for the ceiling play.
| WEEKLY POINT TOTALS | ||||||||||||||
| PLAYER | PTS | 1 | 2 | 3 | 4 | 5 | 6 | 7 | 8 | 9 | 10 | 11 | 12 | 13 |
| Sanders, Jason MIA PK | 169.1 | 4.6 | 11.7 | 7 | 18.7 | 22.5 | 5.4 | B | 4 | 14.6 | 12.4 | 10.4 | 12.5 | 12.5 |
| Koo, Younghoe ATL PK | 165 | 9.8 | 17.2 | 4.5 | 14.1 | 20.1 | 2 | 12.2 | 12.7 | B | 13.1 | 23 | 12.1 | |
| Carlson, Daniel LVR PK | 143.8 | 11.4 | 12.2 | 4.4 | 13.8 | 11.1 | B | 9.8 | 6.6 | 7.1 | 13.8 | 7.5 | 5.3 | 8.8 |
| Myers, Jason SEA PK | 143.4 | 9.2 | 5 | 4 | 9.5 | 3 | B | 12.5 | 7.8 | 12.9 | 14.7 | 7.8 | 13.6 | 4.1 |
| Bass, Tyler BUF PK | 140.6 | 1.1 | 7.9 | 5 | 5.4 | 5.3 | 3.8 | 19.3 | 5.8 | 11.7 | 19.7 | B | 11.8 | 10.5 |
| Tucker, Justin BAL PK | 139.4 | 9.1 | 16.8 | 8.8 | 8.6 | 8.5 | 17.7 | B | 8.1 | 7.8 | 4.4 | 9.6 | 2 | 6.7 |
| Zuerlein, Greg DAL PK | 138.6 | 2.3 | 11.9 | 7.5 | 2 | 13.8 | 1.4 | 4.5 | 12.7 | 17.6 | B | 2.9 | 10.3 | -3.9 |
| Gano, Graham NYG PK | 138.4 | 3.1 | 5.6 | 14.1 | 9.9 | 20.7 | 7.3 | 3 | 5.3 | 14.8 | 10.9 | B | 17 | 3.8 |
| Blankenship, Rodrigo IND PK | 135.8 | 5.3 | 16.8 | 9.3 | 13.5 | 11.4 | 8 | B | 1 | 5.3 | 10.7 | 14.1 | 2 | 7.2 |
| Santos, Cairo CHI PK | 135.1 | 9.3 | 2.4 | 3.5 | 2.7 | 10.5 | 13.7 | 5.2 | 14.4 | 4.2 | 7.5 | B | 4.7 | 6.5 |
| Succop, Ryan TBB PK | 134.2 | 2.8 | 7.3 | 8.8 | 4.6 | 15.5 | 10 | 8.9 | 16.8 | 4.8 | 13.8 | 6.8 | 5.6 | B |
| Lutz, Wil NOS PK | 124.6 | 9 | 6.1 | 14.4 | 5 | 16.7 | B | 11.4 | 12.9 | 8.6 | 10.2 | 2.2 | 8 | 0 |
Simulating Optimal Outcomes
If you are on Twitter, you likely noticed that the #SFB11 tag is flying around every other tweet this time of the year. I managed to use this to my advantage to compile and aggregate statistics from 25 different mock drafts for this format to generate an average draft position for each player as well as the standard deviation (SD) associated with that ADP.
When you have the SD in addition to just the average for each player, you can do so much more. For example, Ryan Tannehill has an ADP of 28.2 and an SD of 8.7. Say you are one of the lucky ones to pull the 1.01 and want to take Tannehill at pick 24 overall. Well, he has an ADP of 28.2 so he should definitely be there, right? Wrong. He will only be there 68% of the time.
Using this procedure and with the aid of a little linear algebra, I set up a snake draft simulation tool to show all the different builds you can utilize from a given draft position.
Introducing Variance
In order for this to be a true simulation so we would get different outcomes, I had to introduce randomness. Between each run of the simulation, 50% of the player pool is eliminated at random. At a given pick you are only able to select a player with at least a 33% likelihood of being available at that pick. Coupling these two elements will create a situation where some value slips through, but players you expected to fall will not just like in a real draft.
Optimization
As I worked through the process of creating this tool I had to constrain how the optimization would actually select the players.
- We want to maximize our total points from our starters over the first eleven rounds of the draft
- Through those 11 rounds, we want to draft two QBs, two or more RBs, three or more WRs, at least one TE, and a total of 11 players including kickers.
- We need the ability to lock players to play around with different roster configurations.
- We need the ability to eliminate players from the player pool we don’t want on our teams
Examples
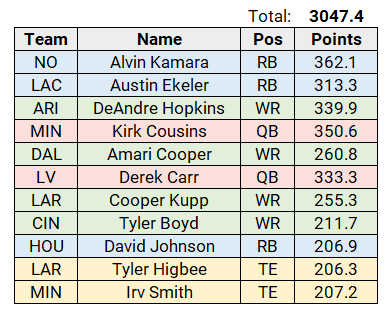
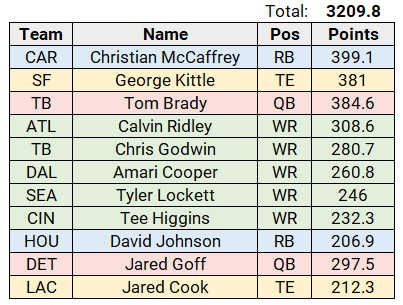
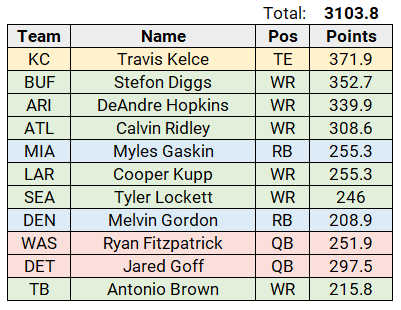
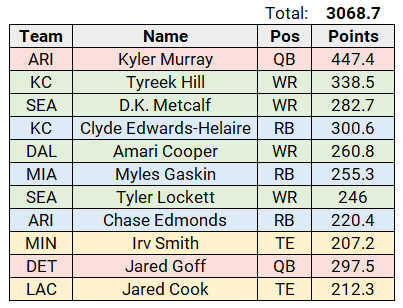
Since both Shawn and Colm are drafting out of the 1.03 draft position, I thought it would be a fun exercise to generate some optimal lineups with the RotoViz projections. All nine of these were generated organically with the tool without forcing any players to be selected.
As I said before, you can draft an optimal team, scoring roughly 3000-3200 projected points in 2021 with any of the popular draft strategies from any draft position.
After discussing these lineups with Shawn, I utilized the locking/blocking feature of the tool to plan out a more curated draft.
Isolating Priority Targets
- Reduced the possible population of RBs that could be selected to:
- Christian McCaffrey, Jonathan Taylor, Antonio Gibson, Myles Gaskin, Travis Etienne, Javonte Williams, James Conner, Zack Moss
- Reduced possible population of TEs that could be selected to:
- Travis Kelce, George Kittle, Darren Waller, T.J. Hockenson, Logan Thomas, Mike Gesicki
- Additionally, we reduced the WR population between permutations. This was done so that the simulation would select priority targets more frequently without specifically forcing them into lineups.
Using the tool, here are a few entirely plausible drafts that I think Shawn would come away extremely happy with.
The Tool
The good news is that you can go through this same process yourself! I am making the tool available for download here!
Instructions
- Download the Excel spreadsheet (must be Excel and not Google Sheets).
- When you open, make sure you click the pop-up to enable editing and macros.
- Install the OpenSolver (Linear) plugin.
Here is a short video explaining how to utilize the tool:
Enjoy!
Footnotes[+]Footnotes[−]
| ↑1 | It’s been theorized that QBs own their sacks, so this addition is in line with Scott’s goal of punishing poor play. |
|---|---|
| ↑2 | They aren’t, but I will get into why we don’t care later. |
| ↑3 | Spoiler: it wasn’t |


