The year is 2021 and we are still having the same debate that’s been going on for over 10 years. It is particularly poignant this year with the cancellation of the NFL combine due to COVID-19. Why are pro day forty times faster than combine forty times and should we be adjusting them to get an apples-to-apples comparison with official combine laser timing?
With no NFL combine this year, we are limited to the results we get out of the individual schools at their prospective pro days. As someone who spends a great deal of energy each year developing models to help predict prospect’s NFL futures, it was important for me to get this correct. We need to know if the 2021 results are reliable and if there is a need to apply some uniform adjustment factor to bring them on the level with historical combine results. Currently, the consensus point of view is that we should add somewhere between 0.03 and 0.07 seconds to a player’s pro day time to account for the difference between combine laser timing and the more rudimentary methods applied at pro days.
Setup
To begin, I managed to compile 1,813 NFL prospects[1]Data courtesy of Kent Lee Platte from the 2003 to 2020 draft classes that recorded a forty time at both the NFL combine and at their school’s pro day. This sample includes all positions. For each player, I calculated the difference in the times (combine – pro day).

Across our sample of players, the average difference between the forty times is 0.08 seconds. Before we go further, I think it is pretty easy to see why the status quo right now is to adjust the times, but let’s take a moment to think here. If you are an NFL caliber prospect, you know how fast you are. If you go to the NFL combine and put up a respectable number on par with what you are capable of, why would you go on to run again at your pro day? The players who ran twice were clearly not happy with their combine performance. We should expect the average pro day times for these players to be faster even without differences in timing techniques. Brian Malone suggested as much back in 2017.
Therefore, just finding the difference between forty and pro day times cannot the final step. The next step in the process is to remove all of the outliers from the sample pictured above. We don’t want Ronald Jones pulling a hammy during the forty negatively affecting our data.
Analysis
With the outliers removed, I pivoted the data to see what conclusions I could draw.

The average historical difference across the different positions is roughly equal, but it appears that the offensive guards and tackles are consistently at the top of the list. This makes sense, as the higher overall times at these positions naturally introduce more opportunity for higher variance. That also means that large differences at the offensive and defensive line positions don’t necessarily implicate the skill positions that fantasy gamers care most about.
Next I wanted to see if the difference is consistent year over year, so I created a box-and-whisker plot showing the error plotted each year. As I suspected, since 2009 the consistency between pro day and combine timing has gotten better and better.

Looking only at the average error each year, this trend becomes much more obvious.
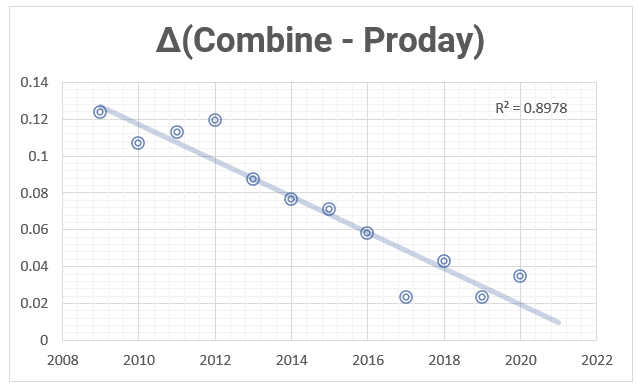
This is likely due to a combination of increased scrutiny[2]Making it tougher for players and teams to lie. and increased uniformity in timing equipment. From 2016 to 2020, the average difference is down over 50% to just 0.038.
Significance Testing
In statistics, there is a common test called a t-test used to compare the averages of two groups of data. It can be used to determine if two groups are significantly different from each other. Here we want to perform a paired t-test to compare the combine and pro day forty times as if they are equal. Based on the earlier findings, I reduced the sample for the test to only include 2016 to 2020 prospects (333 Players).
Footnotes[+]Footnotes[−]
| ↑1 | Data courtesy of Kent Lee Platte |
|---|---|
| ↑2 | Making it tougher for players and teams to lie. |

