Michael Dubner proposes the use of Functional Fantasy Points as a measure for volatility, and finds a counterintuitive result in the way you can use volatility to your advantage in best ball tactics.
Will Fuller is a boom-or-bust option. Larry Fitzgerald is Mr. Reliable. You’ve probably heard something to that effect before, but have you ever wondered whether consistency actually matters in fantasy football? It makes intuitive sense that the way in which players score fantasy points matters, and there is some anecdotal evidence.
In 2019, Fuller was one of the 10 most volatile WRs,[1]Volatility determined using coefficient of variation. and his above-average 10.8% Win Rate in MFL10 Best Ball leagues was largely fueled by one spike-week performance.

On the other hand, a player who was one of the 10 most consistent WRs in 2019, Fitzgerald, scored over 40 more PPR points than Fuller, was even drafted one round later, and yet Fuller still had the higher Best Ball Win Rate (10.8% vs. 8.4%).
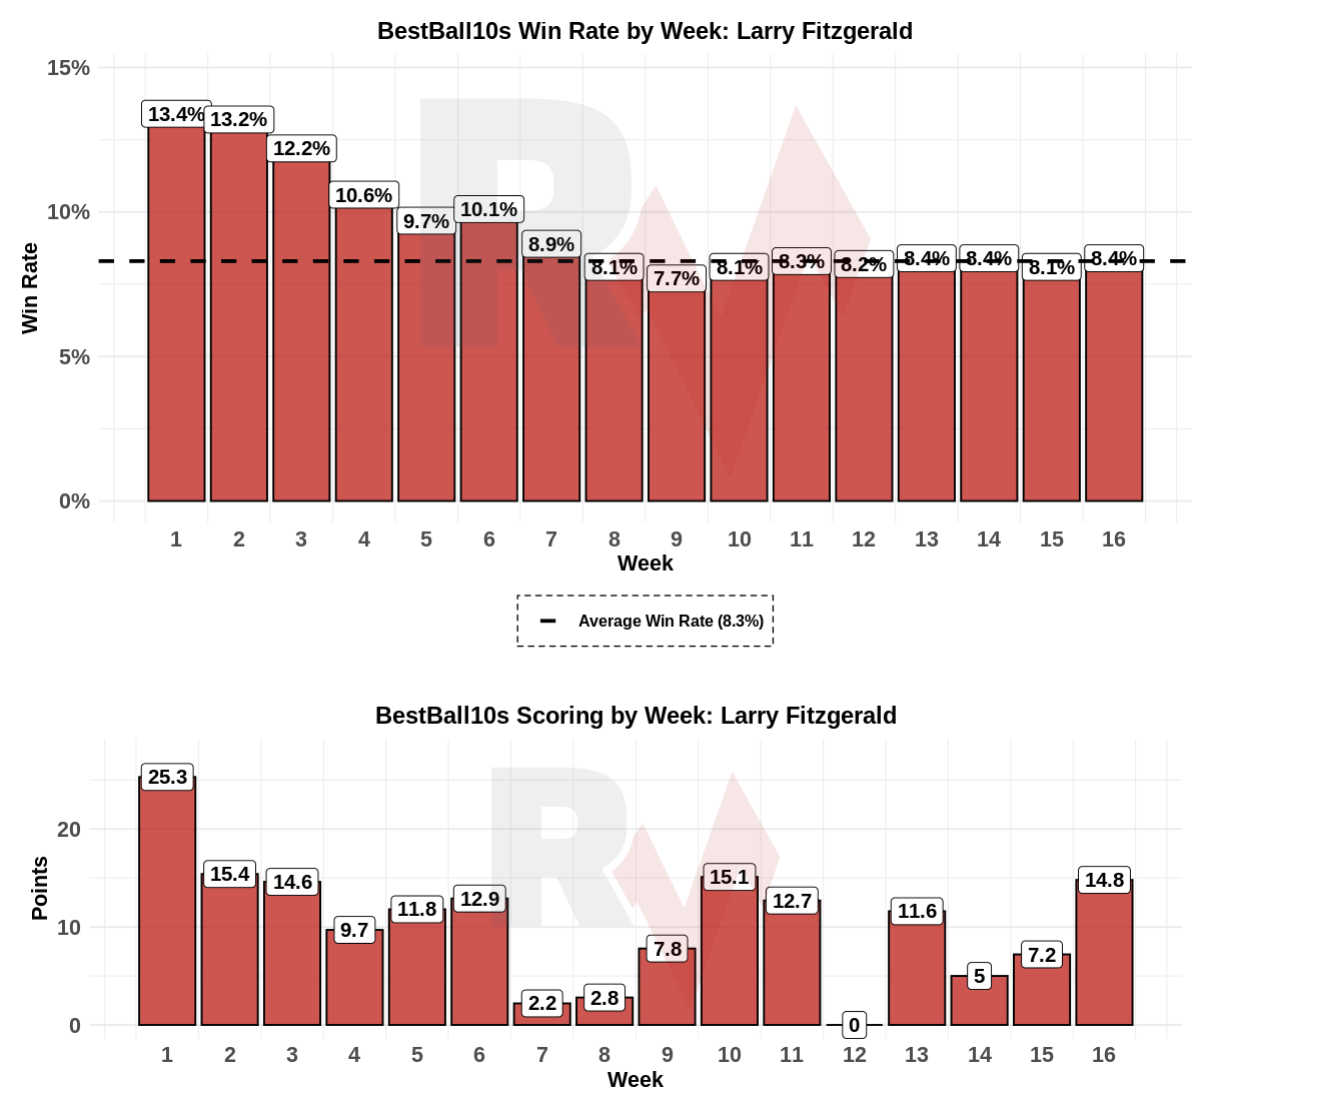 The way a player accumulates fantasy points — consistency versus volatility — likely matters. But how do we properly measure consistency and volatility for fantasy football? And how much does it matter?
Functional Fantasy Points
Functional Fantasy Points are the most intuitive way to measure the impact of consistency and volatility in fantasy football. We can calculate Functional Fantasy Points using a player’s weekly fantasy points and subtracting a predefined baseline number of points per game. All scores below the baseline are recorded as a zero. We’ll use WR36 PPR points per game as the baseline because most 12-team leagues start 3 WRs.
An important feature of Functional Fantasy Points is players do not record negative points for scoring below the baseline. Players who score below the baseline in a given week will receive zero Functional Fantasy Points for that week, meaning zero fantasy points and 0.1 points below baseline are effectively the same thing — both counting as zero Functional Fantasy Points.
The reason for this is that in best ball leagues, we care about how many points a player adds to our starting lineup (how many more points they score than your highest-scoring bench player). If they don’t score enough points in a given week to enter our starting lineup, they might as well have scored zero points.
Volatility Vs. Upside
Functional fantasy points help us measure volatility, but we have to differentiate volatility from upside. Volatility is related to the dispersion of weekly points a player scores, while upside is related to a range of outcomes. The major difference is that upside is largely a function of overall scoring, but volatility need not have a connection with total PPR (though it often does, as we’ll see below). While upside and volatility are both connected to total points, volatility doesn’t necessarily tell us a player’s upside in any given week.
Upside is best measured using tools such as the RotoViz Range of Outcomes App, which Dave Caban does a tremendous job explaining. While the distinction between volatility and upside may appear to be nitpicky, the nuanced differentiation is important for thinking about the ways in which players score points.
Explaining the Will Fuller vs. Larry Fitzgerald Paradox
I’ll compare and contrast the Fuller and Fitzgerald example from earlier using Functional Fantasy Points. To recap: Fitzgerald scored more total PPR and was drafted later than Fuller, yet Fuller had the higher win rate.
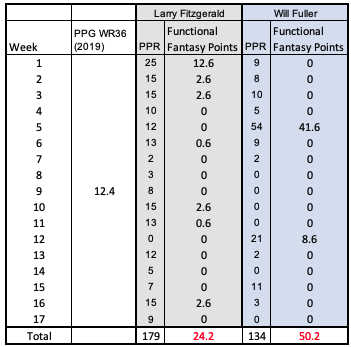
Fuller scoring 2x more Functional Fantasy Points than Fitzgerald likely explains the win rate discrepancy.
Do Functional Fantasy Points Matter?
Looking at Best Ball Win Rates
Now that we understand what Functional Fantasy Points (FFP) measure, let’s see how FFP can be applied to our strategy. First, we need to see if FFP actually explain the differences in win rates.
Sample:
- WRs from 2014-19 with an ADP in the top 240. All players with a 0% Win Rate were removed (339 players remain in the sample).
Adjusted Win Rate Over Expectation
- Players have different win rate expectations based on the round they are drafted in.
- For example, WRs drafted in Round 3 historically have a 9.9% win rate, while WRs drafted in Round 10 have a 6.9% win rate.[2]One explanation for this difference is the effect of roster construction.
- To control for this, we can look at WR Win Rates broken out by round drafted to create an Adjusted Win Rate Over Expectation.[3]i.e. The average win rate for WRs drafted in Round 5 was determined. Then Win Rates for WRs drafted in Round 5 were subtracted from the average Round 5 Win Rate in order to calculate the Adjusted Win Rate Over Expectation.
Results
Footnotes[+]Footnotes[−]
| ↑1 | Volatility determined using coefficient of variation. |
|---|---|
| ↑2 | One explanation for this difference is the effect of roster construction. |
| ↑3 | i.e. The average win rate for WRs drafted in Round 5 was determined. Then Win Rates for WRs drafted in Round 5 were subtracted from the average Round 5 Win Rate in order to calculate the Adjusted Win Rate Over Expectation. |

